
Beat the Market Like Zacks: UnitedHealth, Casey's, Cencora in Focus
All of the three widely followed indexes closed out last week with gains. The tech-heavy Nasdaq Composite, the S&P 500 and the Dow Jones Industrial Average jumped 0.9%, 1% and 1.3%, respectively, marking four straight weeks of gains.
Weak economic data and inflation slowing down over the last few weeks have raised hope among investors that the Fed might have finally concluded its rate-hike cycle. In fact, there are talks about the possibility of interest rate cuts as early as April 2024. Private sector employment numbers showed a decline for the first time in over three and a half years, leading market participants to believe that the Fed’s restrictive monetary policy is also showing its impact on the labor market. Further, treasury yields have been way down from the multiple decades’ peak seen in October.
The holday shopping season has also started, keeping investor mood upbeat. All eyes will be keenly following the PCE inflation numbers due to be out this week. It is the central bank’s favorite inflation metric and will grant insight into the way forward.
Regardless of market conditions, we, here at Zacks, provide investors with unbiased guidance on how to beat the market.
As usual, Zacks Research guided investors over the past three months with its time-tested methodologies. Given the prevailing market uncertainty, you may want to look at our feats to prepare better for your next action.
Here are some of our key achievements:
Oncology Institute and OFG Bancorp Surge Following Zacks Rank Upgrade
Shares of The Oncology Institute, Inc. TOI have gained 28.4% (versus the S&P 500’s 5.3% increase) since it was upgraded to a Zacks Rank #2 (Buy) on September 25.
Another stock, OFG Bancorp OFG, which was upgraded to a Zacks Rank #2 on September 28, has returned 14.4% (versus the S&P 500’s 6.4% increase) since then.
Zacks Rank, our short-term rating system, has earnings estimate revisions at its core. Empirical research shows a strong correlation between trends in earnings estimate revisions and near-term stock price movements.
A hypothetical portfolio of Zacks Rank #1 (Strong Buy) stocks returned +12.02% this year (through September 4th) vs. +18.2% for the S&P 500 index and +7.6% for the equal-weight S&P 500 index. The portfolio of Zacks Rank #1 stocks is an equal-weight portfolio, while the S&P 500 index is a market-cap-weighted index that has been notably distorted by the strong recent performance of mega-cap stocks.
We are not trying to cherry-pick here. But since this Zacks Model portfolio, consisting of Zacks Rank #1 stocks, is an equal-weight portfolio, the equal-weight S&P 500 index is the appropriate benchmark for comparison. Looked at this way, this portfolio has outperformed the index this year.
The Zacks Model Portfolio - consisting of Zacks Rank #1 stocks – has outperformed the S&P index by more than 13 percentage points since 1988 (Through September 4th, 2023, the Zacks # 1 Rank stocks has generated an annualized return of +24.17% since 1988 vs. +10.82% for the S&P 500 index).You can see the complete list of today’s Zacks Rank #1 stocks here >>>
Check Oncology Institute’s historical EPS and Sales here>>>
Check OFG Bancorp’s historical EPS and Sales here>>>
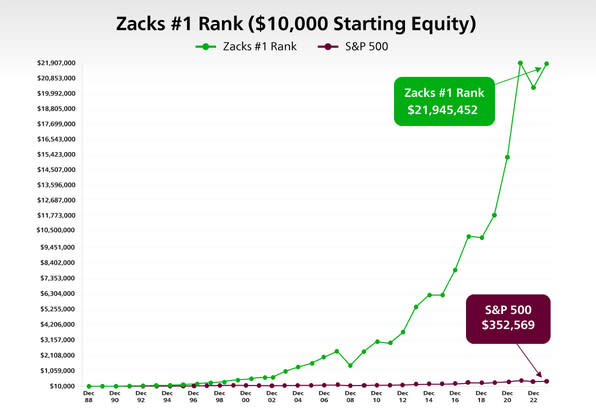
Image Source: Zacks Investment Research
Zacks Recommendation Upgrades Installed TIM and Orange County Bancorp Higher
Shares of TIM S.A. TIMB and Orange County Bancorp, Inc. OBT have advanced 14.6% (versus the S&P 500’s 6.5% rise) and 6% (versus the S&P 500’s 4.9% rise) since their Zacks Recommendation was upgraded to Outperform on September 27 and September 26, respectively.
While the Zacks Rank is our short-term rating system that is most effective over the one- to three-month holding horizon, the Zacks Recommendation aims to predict performance over the next 6 to 12 months. However, just like the Zacks Rank, the foundation for the Zacks Recommendation is trends in earnings estimate revisions.
The Zacks Recommendation classifies stocks into three groups — Outperform, Neutral and Underperform. While these recommendations are determined quantitatively, our analysts have the flexibility to override them for the 1100+ stocks they closely follow based on their better judgment of factors such as valuation, industry conditions and management effectiveness than the quantitative model.
To access our research reports with Zacks Recommendations for the 1100+ stocks we cover, click here>>>
Zacks Focus List Stocks Casey's, Microsoft Shoot Up
Shares of Casey's General Stores, Inc. CASY, which belongs to the Zacks Focus List, have gained 15.4% over the past 12 weeks. The stock was added to the Focus List on August 20, 2019. Another Focus-List holding, Microsoft Corporation MSFT, which was added to the portfolio on February 1, 2016, has returned 15.2% over the past 12 weeks. The S&P 500 has advanced 1.1% over this period.
The 50-stock Zacks Focus List model portfolio returned +22.3% in 2023 (through July 31st) vs. +20.6% for the S&P 500 index and +10.5% for the equal-weight S&P 500 index. In 2022, the portfolio produced -15.2% vs. the S&P 500 index’s -17.96%.
Since 2004, the Focus List portfolio has produced an annualized return of +11.27% through July 31st, 2023. This compares to a +9.65% annualized return for the S&P 500 index in the same time period.
On a rolling one-, three- and five-year bases, the Zacks Focus List returned +21.76%, +16.33%, and +12.54% vs. +12.99%, +13.71% and +12.19% for the S&P 500 index, respectively.
Unlock all of our powerful research, tools and analysis, including the Focus List, Zacks #1 Rank List, Equity Research Reports, Zacks Earnings ESP Filter, Premium Screener and more, as part of Zacks Premium. Gain full access now >>
Zacks ECAP Stocks Cencora and Novo Nordisk Make Significant Gains
Cencora, Inc. COR, a component of our Earnings Certain Admiral Portfolio (ECAP), has jumped 14.4% over the past 12 weeks. Novo Nordisk A/S NVO has followed Cencora with 13.6% returns.
ECAP, which consists of 30 concentrated, ultra-defensive, long-term Buy-and-Hold stocks, has returned +6.67% in 2023 (through June 30) versus +16.90% for the S&P 500 Index. The portfolio returned -4.7% in 2022 versus the S&P 500 Index’s -17.96%.
With little to no turnover and annual rebalance periodicity, the ECAP seeks to minimize capital loss by holding shares of companies whose earnings streams exhibit a proven 20+ year track record of surviving recessionary periods with minimal impact on aggregate earnings growth relative to the overall S&P 500.
The ECAP and many other model portfolios are available as part of Zacks Advisor Tools, a cloud-based solution to access Zacks award-winning stock, mutual fund and ETF research. Click here to schedule a demo.
Zacks ECDP Stocks UnitedHealth and Starbucks Outperform Peers
UnitedHealth Group Incorporated UNH, which is part of our Earnings Certain Dividend Portfolio (ECDP), has returned 14.8% over the past 12 weeks. Another ECDP stock, Starbucks Corporation SBUX, has climbed 5.5% over the same time frame. Of course, the inclination of investors toward quality dividend stocks to secure an income stream amid heightened market volatility contributed to this performance.
Check UnitedHealth’s dividend history here>>>
Check Starbucks’ dividend history here>>>
With an extremely low Beta and a history of minimum earnings variability over the last 20+ years, this 25-stock portfolio helps significantly mitigate risk.
ECDP has returned +0.18% in 2023 (through June 30) versus +16.90% for the S&P 500 Index. The portfolio returned -2.3% in 2022 versus -17.96% for the S&P 500 Index and -8.34% for the ProShares S&P 500 Dividend Aristocrats ETF NOBL.
Click here to access this portfolio on Zacks Advisor Tools.
Zacks Top 10 Stocks — Hubbell Delivers Solid Returns
Hubbell Incorporated HUBB, from the Zacks Top 10 Stocks for 2023, has surged 28.1% year to date, which compares to a 20.4% gain for the S&P 500 Index.
The portfolio returned +16.16% through the end of July 2023 vs. +20.64% for the S&P 500 index and +10.73% for the equal-weighted version of the index. The portfolio returned -15.8% in 2022 vs. -18.1% for the S&P 500 index. Since 2012, the Top 10 portfolio has generated an annualized return of +22.78% vs. +13.65% for the S&P 500 index.
Since the start of 2012 through July 31, 2023, the Zacks Top 10 Stocks have produced a cumulative return of +977.47% vs. +340.35% cumulative return for the S&P 500 index.
Want the latest recommendations from Zacks Investment Research? Today, you can download 7 Best Stocks for the Next 30 Days. Click to get this free report
Microsoft Corporation (MSFT) : Free Stock Analysis Report
UnitedHealth Group Incorporated (UNH) : Free Stock Analysis Report
Novo Nordisk A/S (NVO) : Free Stock Analysis Report
Starbucks Corporation (SBUX) : Free Stock Analysis Report
Cencora, Inc. (COR) : Free Stock Analysis Report
Casey's General Stores, Inc. (CASY) : Free Stock Analysis Report
OFG Bancorp (OFG) : Free Stock Analysis Report
Hubbell Inc (HUBB) : Free Stock Analysis Report
ProShares S&P 500 Dividend Aristocrats ETF (NOBL): ETF Research Reports
TIM S.A. Sponsored ADR (TIMB) : Free Stock Analysis Report
Orange County Bancorp, Inc. (OBT) : Free Stock Analysis Report
The Oncology Institute, Inc. (TOI) : Free Stock Analysis Report
