
Small Cap Breakout: Can it Finally Stick?
The Russell 2000 Index is a benchmark that tracks approximately 2000 small-cap stocks with a market capitalization between $300 million and $2 billion. Unfortunately, for small-cap investors trading the Russell 2000 and small cap proxies like the Russell 2000 Index ETF (IWM) or the Direxion SC Bull (TNA) has been by far the most frustrating index of the year. While the S&P 500 Index ETF (SPY) is up ~20% and the Nasdaq 100 Index ETF (QQQ) is up nearly 25% year-to-date, IWM is up a paltry 1.93% and is suffering its longest drawdown from all-time highs in its history.
High Interest Rates are a Headwind for Small Caps
The U.S. Federal Reserve and Fed Chairman Jerome Powell can be blamed for much of the underperformance in small caps over the past few years. A few years ago, Powell was caught between a rock and a hard place, with inflation ballooning to its highest level in more than 40 years. In response, Powell and the Fed did a complete 360 and raised rates rapidly, transforming from “dovish” to an ultra “hawkish” stance seemingly overnight.
For those who don’t know, small caps suffer under higher interest rates because small caps need to borrow more than their peers, and their borrowing costs increase when rates increase. With so many fake outs so far in 2024 for small caps, how do investors gauge whether this breakout is real? Below are three metrics that will provide clues:
Rate Cut Odds
This morning, the Consumer Price Index (CPI) number was released and showed the first negative print since 2020, hinting that inflation may be defeated, or at the very least, under control. If inflation is finally broken, it’s great news for small caps because the odds of a rate cut in September spiked to 83% this morning.
Common Gaps vs. Power Gaps Close is Important
A gap occurs when a stock or index moves outside of regular trading hours causing a space on the chart. Though it may seem counterintuitive I have found that power gaps in indices (gaps of 2% or more on massive volume) tend to stick more than common gaps (gaps of less than 1% on low volume). At the time of this writing IWM is up 2.48% on volume three times higher than the 50-day average.
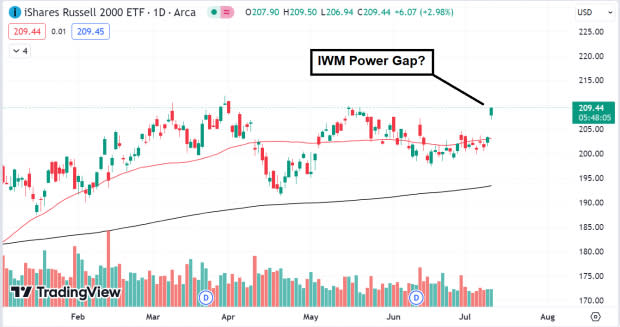
Image Source: TradingView
Rotation
Large-cap tech stocks have outperformed dramatically in the current bull market. However, today was the first sign that a broadening out or rotation in the market may be around the corner. Though the IWM is up dramatically, the tech-heavy QQQ is red on the session. Rotation or consolidation in big tech names bodes well for a year-end small-cap rally.
Bottom Line
Lower inflation means lower interest rates – a bullish sign for small-cap stocks into year-end.
Want the latest recommendations from Zacks Investment Research? Today, you can download 7 Best Stocks for the Next 30 Days. Click to get this free report
Invesco QQQ (QQQ): ETF Research Reports
SPDR S&P 500 ETF (SPY): ETF Research Reports
iShares Russell 2000 ETF (IWM): ETF Research Reports
Direxion Daily Small Cap Bull 3X Shares (TNA): ETF Research Reports
