
NVIDIA (NVDA) Q3 Earnings Miss Estimates, Revenues Surpass
NVIDIA Corporation NVDA reported mixed results for the third quarter of fiscal 2023. The bottom line missed the Zacks Consensus Estimate, while the top line surpassed the same. However, third-quarter earnings and revenues both declined significantly on a year-over-year basis.
For the third quarter, NVIDIA reported non-GAAP earnings of 58 cents per share, which missed the Zacks Consensus Estimate by 17.1%. Moreover, the reported figure plunged 50% year over year while increasing 14% sequentially. The year-over-year decline in earnings was mainly due to lower revenues and increased operating expenses.
Third-quarter revenues plunged 17% year over year and 12% sequentially to $5.93 billion, primarily due to continued weakness across its Gaming and Professional Visualization market segments. Lower data center demand in China also hurt the top line in the reported quarter. However, the top line beat the consensus mark of $5.81 billion.
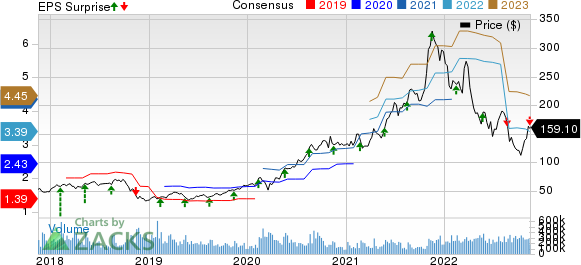
NVIDIA Corporation Price, Consensus and EPS Surprise
NVIDIA Corporation price-consensus-eps-surprise-chart | NVIDIA Corporation Quote
Segment Details
NVIDIA reports revenues under two segments — Graphics and Compute & Networking.
Graphics includes GeForce GPUs for gaming and personal computers, the GeForce NOW game-streaming service and related infrastructure. The segment also offers solutions for gaming platforms, Quadro GPUs for enterprise design, GRID software for cloud-based visual and virtual computing and automotive platforms for infotainment systems.
Graphics accounted for 35.7% of fiscal third-quarter revenues. The segment’s top line plunged 48% year over year and 24% sequentially to $2.12 billion.
Compute & Networking represented 64.3% of fiscal third-quarter revenues. The segment comprises Data Center platforms and systems for artificial intelligence, high-performance computing and accelerated computing, the DRIVE development platform for autonomous vehicles, and Jetson for robotics and other embedded platforms.
Compute & Networking revenues soared 27% year over year to $3.82 billion. However, the segment’s revenues declined 2% sequentially.
Market Platform’s Top-Line Details
Based on the market platform, Gaming revenues plunged 51% year over year and 23% sequentially to $1.57 billion and accounted for 26.5% of total revenues. The decline was primarily due to a lower sell-in of Gaming products. This reflected a reduction in channel partner inventory levels amid weak demand due to macroeconomic headwinds and lockdowns in China, which continue to weigh on consumer demand.
Revenues from Data Center (64.6% of revenues) jumped 31% year over year and 1% from the previous quarter to $3.83 billion. This year-over-year rise was driven by the strong demand for its chips across U.S. cloud service providers, consumer internet companies and other vertical industries.
However, softness in China and the U.S. government’s new restrictions on the export of A100 and H100-based products to China negatively impacted the top line.
Professional Visualization revenues (3.4% of revenues) decreased 65% year over year and 60% sequentially to $200 million. The decline was primarily due to a lower sell-in to partners to help align channel inventory levels with the current demand expectations.
Automotive sales (4.2% of revenues) in the reported quarter totaled $251 million, up 86% on a year-over-year basis and 14% sequentially. The increase was mainly driven by the increased revenue contribution from self-driving solutions.
OEM and Other revenues (1.3% of revenues) plunged 69% year over year and 48% sequentially to $73 million. The decline was mainly due to the weak performance of Cryptocurrency Mining Processors, which generated nominal sales in the quarter compared with $105 million in the year-ago quarter. Moreover, lower Jetson and notebook OEM sales also negatively impacted the overall unit’s performance in the third quarter.
Operating Details
NVIDIA’s non-GAAP gross margin contracted by 10.9% year over year to 56.1%, mainly due to a $702 million charge for inventory, largely related to the lower Data Center demand in China. This was partially offset by a warranty benefit of approximately $70 million.
Non-GAAP operating expenses flared up 30% year over year and 3% sequentially to $1.79 billion on higher compensation-related expenses associated with employee growth and increased data center infrastructure-related expenses.
The non-GAAP operating income slumped 55% year over year to $1.54 billion.
Balance Sheet and Cash Flow
As of Oct 30, 2022, NVDA’s cash, cash equivalents and marketable securities were $13.14 billion, down from $17.04 billion as of Jul 31, 2022.
As of Oct 30, 2022, the total long-term debt (including current maturities) was $10.95 billion, flat with the previous quarter ended Jul 31, 2022.
NVIDIA generated $392 million in operating cash flows, down from the year-ago quarter’s $1.52 billion and the previous quarter’s $1.27 billion. The free cash flow was an outflow of $156 million compared to the inflow of the year-ago quarter’s $1.28 billion and the previous quarter’s $824 million.
In the first nine months of fiscal 2023, the company generated operating and free cash flows of $3.39 billion and $2.02 billion, respectively.
In the third quarter, the company returned $3.59 billion to shareholders through $100 million in dividend payouts and $3.49 billion in share repurchases. In the first three quarters of fiscal 2023, NVIDIA paid out $300 million in dividends and bought back common stocks worth $8.83 billion.
Fourth-Quarter Guidance
For the fourth quarter of fiscal 2023, NVIDIA anticipates revenues of $6 billion (+/-2%), lower than the Zacks Consensus Estimate of $6.23 billion. The company expects to resume sequential growth in the Gaming segment. It also forecasts modest sequential growth across the Data Center and Automotive divisions.
The GAAP and non-GAAP gross margins are projected at 63.2% and 66%, respectively (+/-50 bps). GAAP and non-GAAP operating expenses are estimated at $2.56 billion and $1.78 billion, respectively.
GAAP and non-GAAP other income and expenses, excluding gains and losses from non-affiliated investments, are anticipated at approximately $40 million.
The GAAP and non-GAAP tax rate for the quarter is estimated at 9% (+/- 1%). The company projects to make capital expenditures between $500 million and $550 million during the quarter.
Zacks Rank & Stocks to Consider
NVIDIA currently carries a Zacks Rank #4 (Sell). Shares of NVDA have decreased 44.9% year to date (YTD).
Some better-ranked stocks worth considering from the broader technology sector are Celestica CLS, Zscaler ZS and Coupa Software COUP. Celestica sports a Zacks Rank #1 (Strong Buy) at present, while Zscaler and Coupa each carry a Zacks Rank #2 (Buy). You can see the complete list of today's Zacks #1 Rank stocks here.
The Zacks Consensus Estimate for Celestica’s fourth-quarter 2022 earnings has increased by 9 cents to 53 cents per share over the past 30 days. For 2022, earnings estimates have moved 9.4% up to $1.86 per share in the past 30 days.
CLS' earnings beat the Zacks Consensus Estimate in each of the preceding four quarters, the average surprise being 11.8%. Shares of the company have increased 2.8% YTD.
The Zacks Consensus Estimate for Zscaler's second-quarter fiscal 2023 earnings has been revised 5 cents north to 26 cents per share over the past 90 days. For fiscal 2023, earnings estimates have moved a penny north to $1.18 per share in the past 60 days.
ZS’ earnings beat the Zacks Consensus Estimate in each of the preceding four quarters, the average surprise being 28.6%. Shares of the company have declined 56.3% YTD.
The Zacks Consensus Estimate for Coupa's fourth-quarter fiscal 2023 earnings has been revised 3 cents northward to 7 cents per share over the past 90 days. For fiscal 2023, earnings estimates have moved upward by 19 cents to 44 cents per share in the past 90 days.
Coupa's earnings beat the Zacks Consensus Estimate in each of the preceding four quarters, the average surprise being 478.1%. Shares of COUP have slumped 77% YTD.
Want the latest recommendations from Zacks Investment Research? Today, you can download 7 Best Stocks for the Next 30 Days. Click to get this free report
NVIDIA Corporation (NVDA) : Free Stock Analysis Report
Celestica, Inc. (CLS) : Free Stock Analysis Report
Coupa Software, Inc. (COUP) : Free Stock Analysis Report
Zscaler, Inc. (ZS) : Free Stock Analysis Report
To read this article on Zacks.com click here.
Zacks Investment Research
