
Market on Tipping Point of New Bull Trend: These 5 Charts Illustrate Why
There is no specific indicator or warning that tells investors when the direction of the market is about to change or has already changed. On Wall Street, “no one rings a bell” when the trend changes from a bull market to bear market and vice versa. For this reason, it is essential that investors monitor the market regularly, do their best to put the pieces of the puzzle together, and can make decisions based on incomplete information.
Today we will cover 5 charts that show we are on the tipping point of entering a bull market:
Spdr S&P 500 Index SPY: The S&P 500 Index is the broadest method U.S. investors have for following markets. Included in the index is 500 large companies such as Apple AAPL, ExxonMobil XOM, Tesla TSLA, and Johnson and Johnson JNJ. As of late 2022, the index had a market cap of $34 trillion.
In January 2022, the S&P 500 index and “SPY,” the largest ETF tracking the index, topped. Since then, there have been several failed rally attempts, also known as bear market rallies. Though the downtrend has been frustrating for investors, there is one light at the end of the tunnel for market technicians: the downtrend is uniform. Each large-scale failed rally attempt has been turned away at a down-trend dating back to the infancy of the bear market trend. In other words, a break and hold above the line is a major signal that the market may be turning from bearish to bullish.
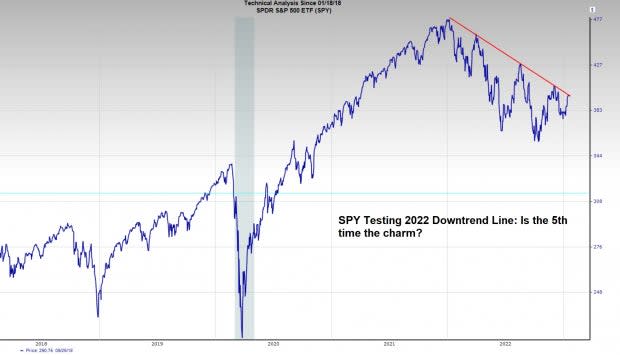
Image Source: Zacks Investment Research
IShares Russell 2000 ETF IWM: Just as large-cap stocks are important to the overall market, so are small-caps. The Russell 2000 Index is a small-cap index tracking some of the smallest publicly traded companies. Components include names such as Matador Resources MTDR, Halozyme Therapeutics HALO, and Texas Roadhouse (TXRH). Investors must see performance from this group of stocks because there are different factors at play for them, such as sector mix, foreign exchange impact, and risk appetite for investors. IWM is the largest ETF tracking these names and is looking to break out above Q4 highs.
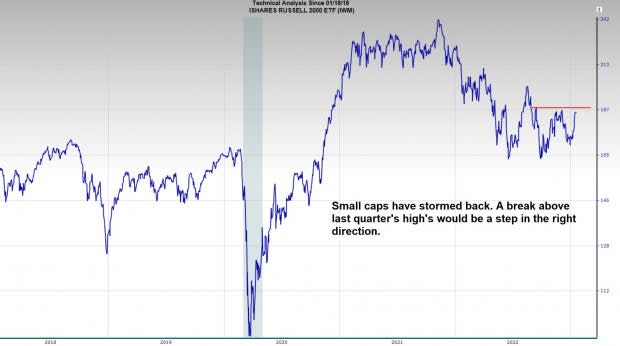
Image Source: Zacks Investment Research
The iShares Biotech ETF IBB tracks the biotech sector within the Nasdaq. IBB has been a significant laggard – while the S&P 500 Index topped in early 2022, IBB topped in August of 2021 and sold off much harder. The Spdr S&P Biotech ETF XBI, which tracks the biotech sector within the S&P 500, topped back in February of 2021. If the market is to continue to strengthen, beaten down sectors such as biotech will have to breathe new life into the market. In the past few months, the industry has shown a distinct change of character and demonstrated leadership. A break above last quarter’s resistance in IBB should renew confidence in these names for investors.
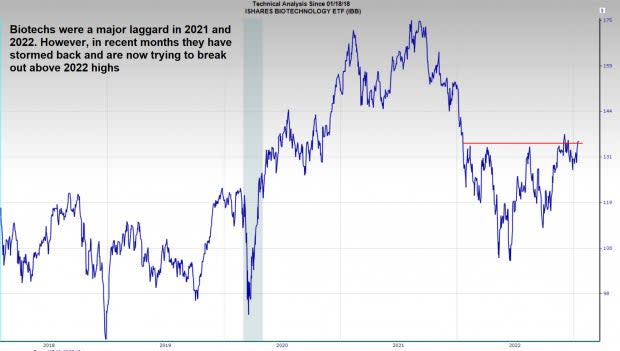
Image Source: Zacks Investment Research
Semiconductors are another such group that led the market on the way up and the way down. Like IBB, the Vaneck Semiconductor ETF SMH has seemingly turned the corner and is now in an uptrend.
The iShares MSCI World Index ETF URTH is an index composed of globally developed market equities. Why is it worth tracking? Simply put, the economy is now global in nature. For example, most countries simultaneously suffered from inflation and a lower stock market. It is tough to imagine an improvement in U.S. markets without and improvement in global markets. Luckily for investors, the index regained its 200-day moving average, signaling a burgeoning uptrend. Investors should watch to see if the index can maintain the 200-day moving forward and begin to trend higher.
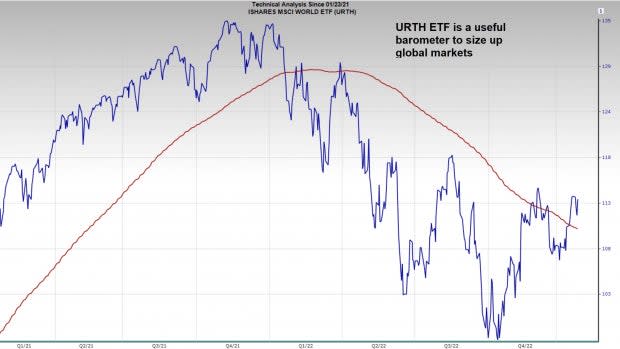
Image Source: Zacks Investment Research
Tech stocks and the Invesco Tech ETF QQQ suffered the brunt of the bear market. High-growth, high-valuation stocks saw non-stop selling as investors migrated to lower valuation safe havens. These stocks will need to stabilize for U.S. markets to truly be back in play. This week should be telling – tech giants such as Microsoft MSFT are slated to report EPS, and the QQQ and Nasdaq sit just atop the 200-week moving average. Over the past 20-years, the 200-week moving average has acted as an important level of support for the index.
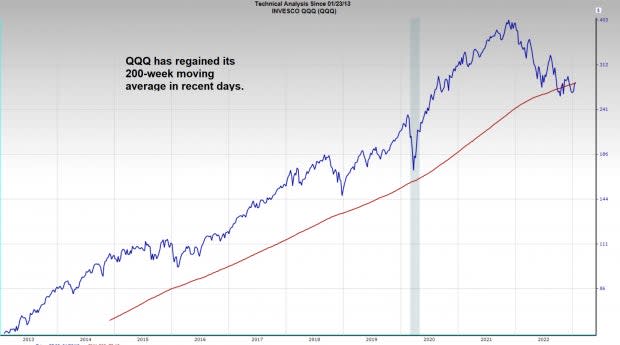
Image Source: Zacks Investment Research
Want the latest recommendations from Zacks Investment Research? Today, you can download 7 Best Stocks for the Next 30 Days. Click to get this free report
Apple Inc. (AAPL) : Free Stock Analysis Report
Microsoft Corporation (MSFT) : Free Stock Analysis Report
Johnson & Johnson (JNJ) : Free Stock Analysis Report
Exxon Mobil Corporation (XOM) : Free Stock Analysis Report
Texas Roadhouse, Inc. (TXRH) : Free Stock Analysis Report
Halozyme Therapeutics, Inc. (HALO) : Free Stock Analysis Report
Tesla, Inc. (TSLA) : Free Stock Analysis Report
iShares Biotechnology ETF (IBB): ETF Research Reports
Invesco QQQ (QQQ): ETF Research Reports
SPDR S&P 500 ETF (SPY): ETF Research Reports
iShares Russell 2000 ETF (IWM): ETF Research Reports
Matador Resources Company (MTDR) : Free Stock Analysis Report
VanEck Semiconductor ETF (SMH): ETF Research Reports
SPDR S&P Biotech ETF (XBI): ETF Research Reports
iShares MSCI World ETF (URTH): ETF Research Reports
