
Malaysian residential properties have become more, not less, affordable

Allowing access to Napic public data will help homebuyers and developers.
Home ownership affordability, or rather, unaffordability, has been a hot-button issue for the longest time, not just domestically but also in many parts of the world. This is unsurprising. Housing is a basic human need (right), with significant long-term health and economic consequences to the country — and a politically sensitive issue for governments, as it is closely associated with discontent over rising income-wealth inequality, whether real or perceived.
Housing becomes less affordable when home price appreciation outpaces the people’s income growth. This happens for a myriad of reasons such as lagging wages growth and low savings, demand exceeding supply due to regulatory, zoning issues and/or land-labour limitations as well as rising costs of construction. And, of course, speculation or asset accumulation, given that property is a major asset class for investment.
There is a widely held perception that housing is increasingly out of reach for the younger generation of Malaysians. We think this perception is not quite accurate. Based on the commonly used median multiple — that is, comparing median house price to median income — housing affordability in Malaysia is roughly the same as it has always been, from the longer-term perspective.
However, we also believe that housing has become more — not less — affordable over the last five years, contrary to public perception. Yes, we know most of you are shocked by this. How can it be? The politicians, economists, research institutions, real estate agents, your neighbours, all and sundry, have been saying properties have become more unaffordable. Hold your horses and read on. This is why you read this column — not to think like everyone else.
Housing price gains have lagged GNI per capita growth over the last five years
Chart 1 shows the Malaysian House Price Index (MHPI) from 2017 to 2022. House price gains have clearly slowed in the past five years, rising at a compound annual growth rate (CAGR) of 2.1%. On the other hand, average income as measured by gross national income (GNI) per capita has risen by a CAGR of 5.1% over the same period — faster than house price gains.

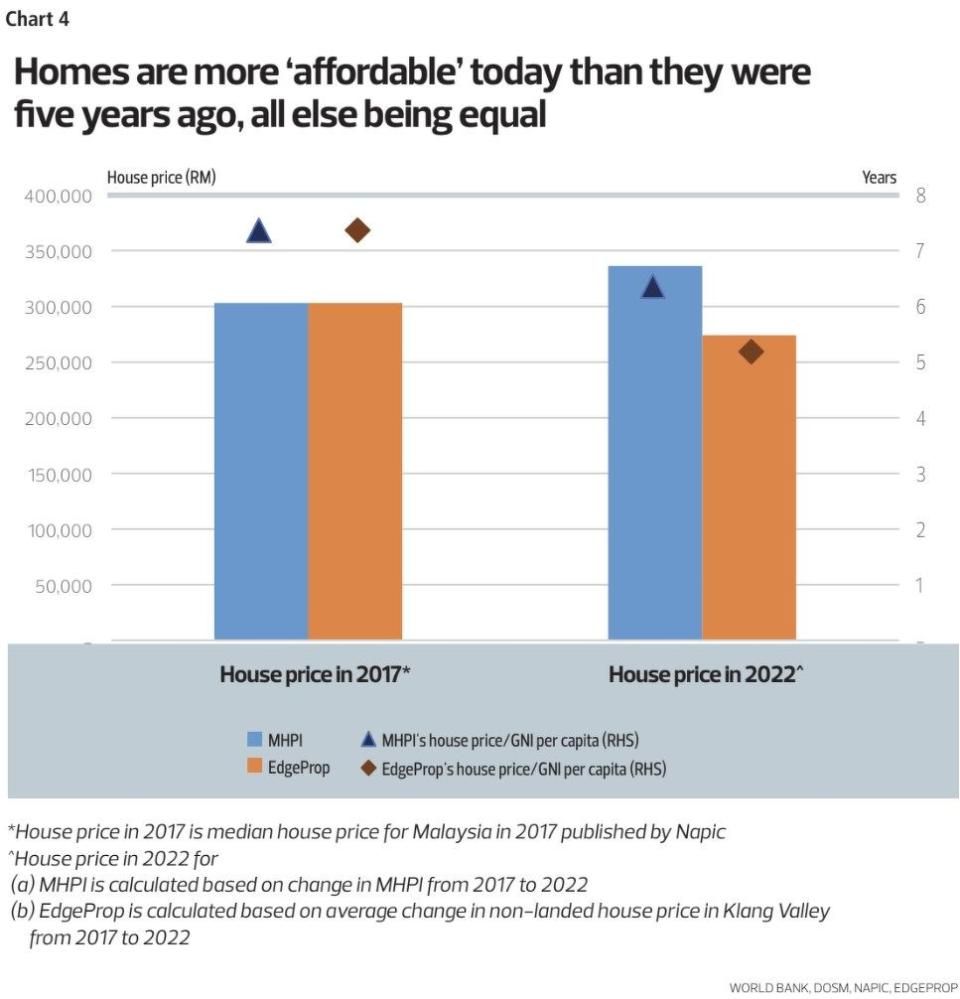
This means that housing affordability has improved — the median house price has fallen from 7.4 times GNI per capita in 2017 to 6.4 times last year. The lower the multiple, the more affordable is home ownership. In fact, housing may be even more affordable than what the MHPI suggests, if you know where to look.
Housing may be even more affordable than you think
The MHPI, as compiled by the National Property Information Centre (Napic), is still rising, albeit at a slower clip. This house price comparison is not apples to apples, in the sense that the index is not tracking the price change for the “same property” over time — but rather the price change for the “average” house.
This average house price, in turn, is derived from actual transacted prices for a basket of landed (terrace, detached, semi-detached) and non-landed (high-low rise) housing across the country, weighted by various factors such as location, land and floor area, age, building quality, house type and floor level. In other words, it reflects not the price of any specific house but rather the price of a fixed set of characteristics the properties embody. While there is some transparency on the factors used, we are doubtful there is clear methodology. Therefore, we see this index as no more than a crude gauge.
The thing is, with such an “average house” price you tend to lose a lot of the nuances that more granular data would show. Case in point: While the MHPI shows consistent uptrend in prices, there is a wide divergence in price changes for individual housing. The question is: What if we compare apples to apples — have prices for the “same property” risen in the past five years across the board? This is similar to comparing same-store sales growth for retailers, as opposed to average sales growth, which will be distorted by new stores opened, store closures, target market, products, location and so on.
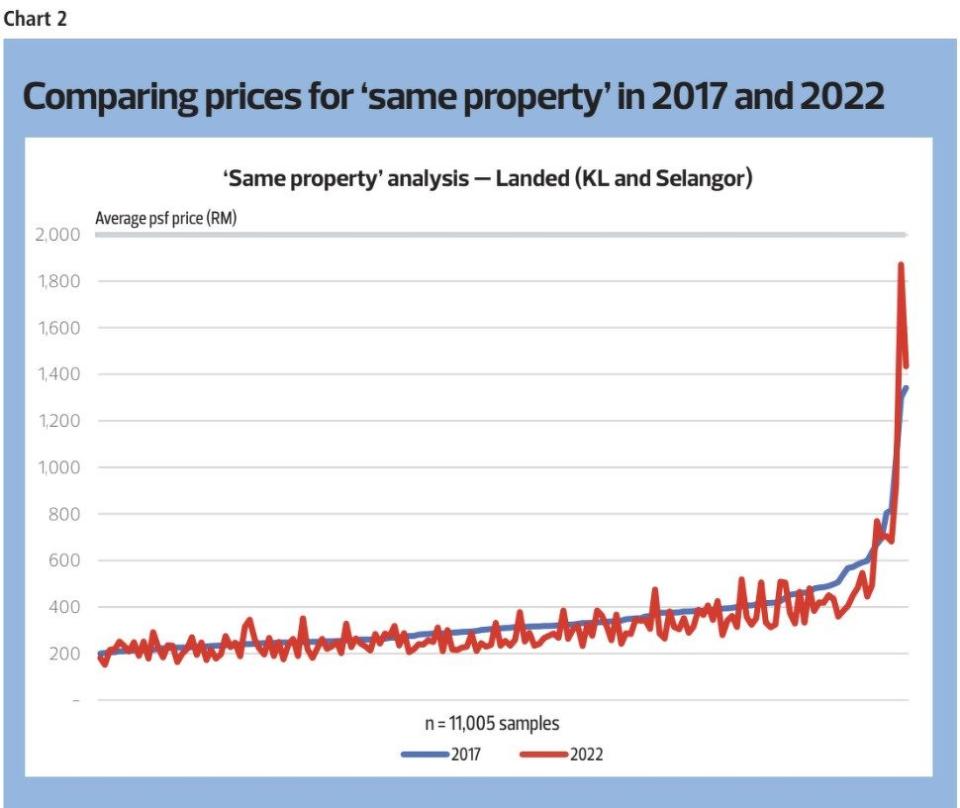
For this simulation, we enlisted the help of EdgeProp.my, a website with comprehensive data on property listings, price data and other useful market information for both the rental and sale markets. (If you ever want to buy, sell or rent a property, we suggest you check out www.edgeprop.my to gain better insights into market prices that will help you make better decisions.) EdgeProp.my collated price data on hundreds of landed and non-landed homes based on actual transacted prices in the secondary market. The results are quite surprising (see Charts 2 and 3).
Chart 2 shows the actual transacted prices (sorted by average price psf) for landed and non-landed properties in the Klang Valley. If you were to draw a vertical line anywhere along the X-axis (horizontal) in the chart, it will show the prices for a specific “same property” (in terms of location and type) in 2017 (blue line) and 2022 (red line). When the red line is above the blue line, it means prices are higher today than in 2017 and vice versa.

To simplify the findings, we summarised all these data points into Chart 3 — by grouping the properties by their percentage price changes. The number of same properties that have fallen in value far exceeded those that have appreciated, for both landed and non-landed. (FYI, this corresponds to the number of incidences where the blue line is above the red line in Chart 2.) The median change in prices for all landed housing is -11.6%, while that for non-landed is slightly worse at -12.6%.
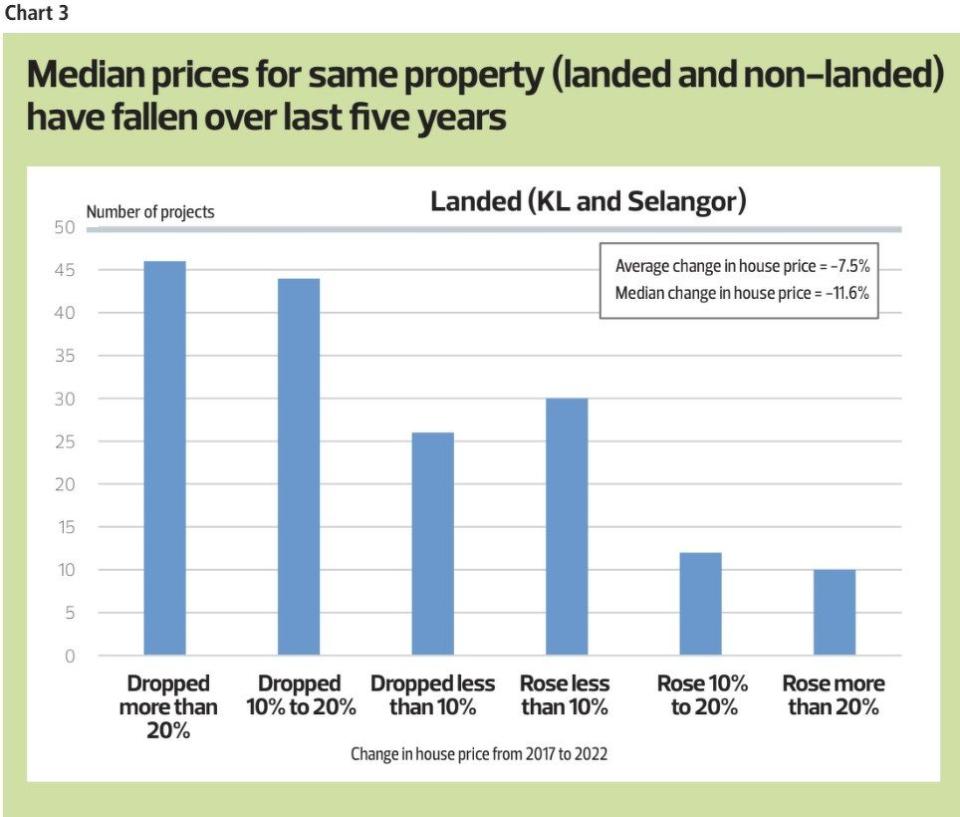

Yes, it means if you bought a home five years ago, the odds are that your property is now worth less than what you paid for — which is contrary to the MHPI data. Part of the reason, we suspect, is how the MHPI is calculated. As we explained, its basket of properties includes housing of various ages, new and old. New launches are almost always priced higher than existing properties in the vicinity — and, as such, the average price is upward biased — due to “depreciation”. Plus, new launch prices are often “inflated” from the actual price, using mechanisms such as discounts, cash rebates and renovation packages.
What does this mean? Well, for starters, buying a house in the secondary market is significantly more affordable today than it was five years ago, all else being equal. The median house price to per capita GNI is only 5.2 times now, compared with 7.4 times in 2017 — and lower than the 6.4 times based on MHPI data (see Chart 4).
Additionally, those looking to buy a property to hedge against inflation or as investment may need to rethink the strategy and available options. It is no longer a “sure win” — that is, property prices do not always only go up. Based on recent statistics, it is not even a 50-50 bet. In fact, investing in property is no different than investing in stocks. The headline index, FBM KLCI, has fallen by 16% over the past 10 years, but you can far outperform with selective stock picking. And you make the best decisions from doing a lot more diligent market research — on the location, the type of property, the developer and so on.
Conclusion
The policy implications of this article are: (i) the property industry is very competitive, driving down prices even as quality improves over time. This is because there are almost no barriers to entry — the property market is a free market with few government interventions. Yet, it is able to meet social obligations like low-cost and affordable housing quotas and the provision of infrastructure for necessities like schools, electricity, water and so on. Perhaps this is a good example for policies for other sectors of the economy.
And (ii), we think the biggest challenge for homebuyers and developers is access to transparent data. While the government, through Napic, collects a vast trove of data, access is limited to property valuers only. Why this must be the case is unclear. What is obvious is that this restriction has allowed some to make money from rent-seeking.
Allowing free access to raw data of all housing stocks and transactions (after removing any private information) will surely make the market more efficient and prices more transparent. It would certainly improve the analytics to help homebuyers and developers.
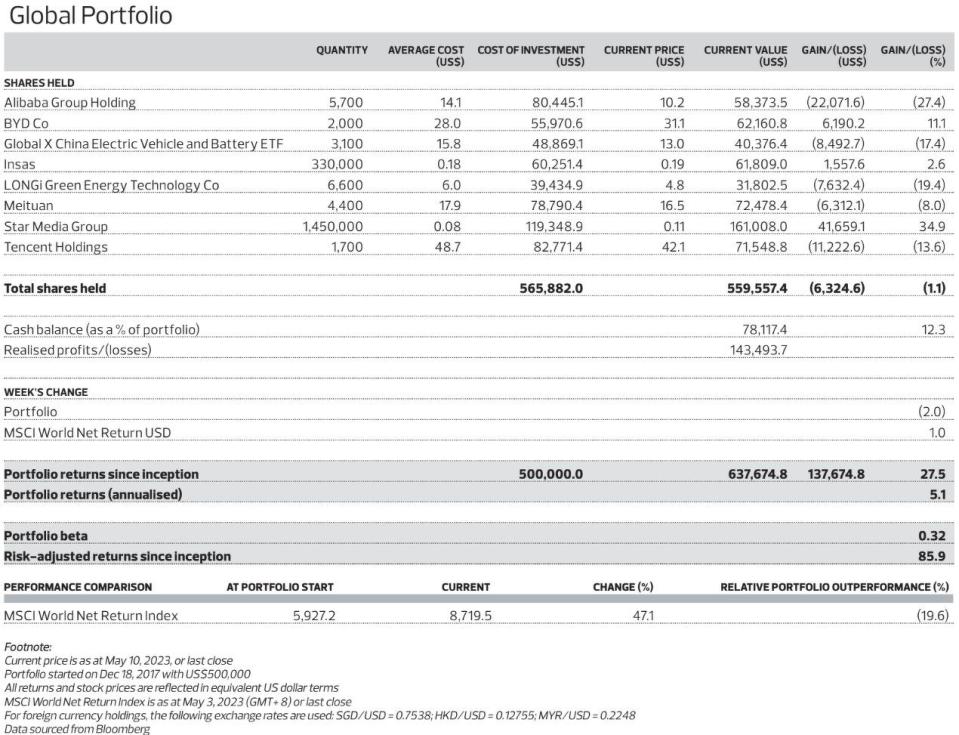
The Global Portfolio fell 2% for the week ended May 10, led by losses from Star Media Group (-6.7%), LONGi Green Energy Technology Co (-4.5%) and Tencent Holdings (-2.7%). On the other hand, shares for BYD Co (+5.2%), Global X China EV and Battery ETF (+0.7%) and Alibaba Group Holding (+0.1%) ended higher for the week. Last week’s losses pared total portfolio returns since inception to 27.5%, trailing the MSCI World Net Return Index’s 47.1% returns over the same period.
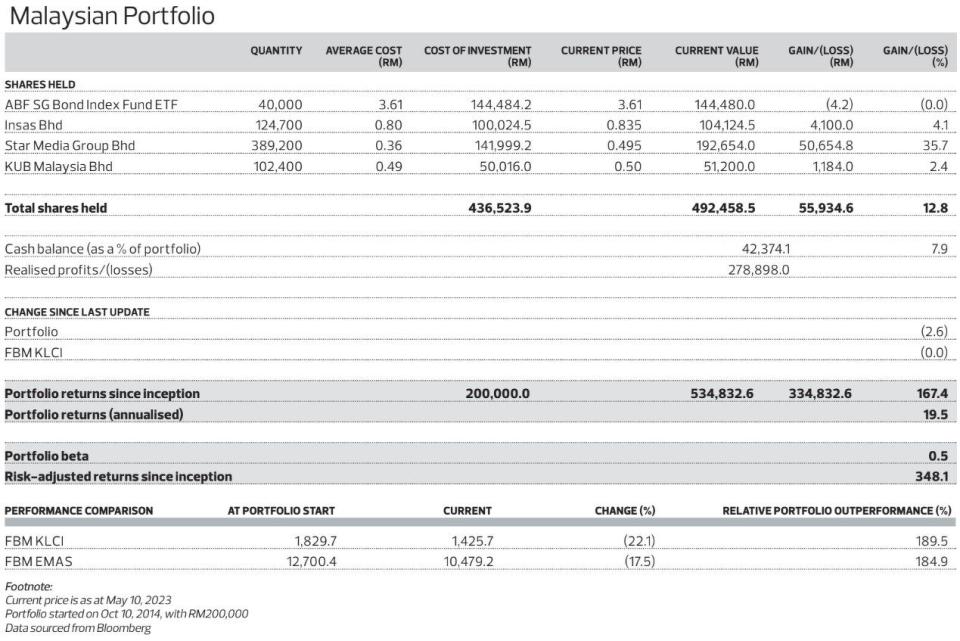
Meanwhile, the Malaysian Portfolio fell 2.6% last week, weighed down by more profit-taking for KUB Malaysia (-6.6%) and Star Media Group (-2.9%). Total portfolio returns now stand at 167.4% since inception. Nonetheless, this portfolio is outperforming the benchmark FBM KLCI, which is down 22.1%, by a long, long way.
Disclaimer: This is a personal portfolio for information purposes only and does not constitute a recommendation or solicitation or expression of views to influence readers to buy/sell stocks, including the particular stocks mentioned herein. It does not take into account an individual investor’s particular financial situation, investment objectives, investment horizon, risk profile and/ or risk preference. Our shareholders, directors and employees may have positions in or may be materially interested in any of the stocks. We may also have or have had dealings with or may provide or have provided content services to the companies mentioned in the reports.
See Also:
Click here to stay updated with the Latest Business & Investment News in Singapore
ABSD hikes amid dimmer economic outlook a pre-emptive measure: Lee
Developers' shares down at market open following latest round of cooling measures
Get in-depth insights from our expert contributors, and dive into financial and economic trends

