
Harnessing the Power of Long-Term Technical Analysis
We live in an era of instant gratification. Want to get food delivered to your door without getting off the couch? Order DoorDash (DASH). Don’t know the answer to something? Simple. Use Alphabet’s (GOOGL) Google search, and you’ll have it within seconds. Often, amateur traders and investors think in the same manner. These new and starry-eyed investors seek to extract money from the market quickly. Unfortunately, trading platforms amplify these emotions by offering up-to-the-second quotes, countless indicators, and flashing lights that would make casino operators like Las Vegas Sands (LVS) blush.
For the reasons mentioned above, newbies often falsely conflate the study of technical analysis as a short-term practice rather than a long-term one. The truth, however, is that technical analysis can be used in any time frame. In fact, the longer the time frame, the more visibility one has. Think about it – it’s easier to predict where the market will be in five years or fifteen years than it is to predict where it will be in five seconds or five days. Why? Because longer-term charts smooth out the data and present investors with the big picture.
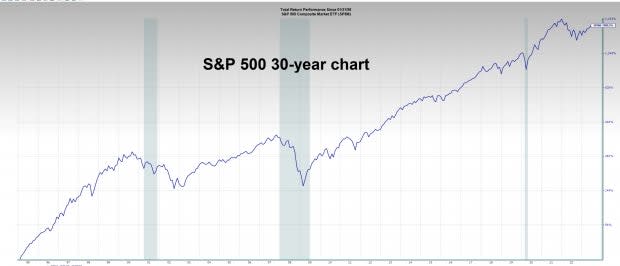
Image Source: Zacks Investment Research
Pictured: 30-year S&P 500 chart
While I know no one with a crystal ball, the chart above illustrates that U.S. equities move higher over time. The critical part is to determine the general zone in which a long-term bottom is likely to occur and pounce.
The Power of the 200-Week Moving Average
What if I told you that there was an indicator that nailed every bottom in the Nasdaq 100 ETF (QQQ) dating back to the financial crisis? Though it’s not sexy and may be often overlooked, the 200-week moving average is that indicator.
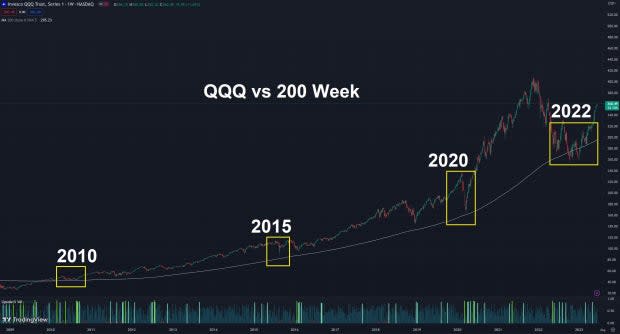
Image Source: Tradingview
Why does the 200-Week Moving Average Work?
One guess is that institutional investors with deep pockets use it as a reference point. However, the reasoning behind such a simple indicator’s robustness is not important. What is important is that it works. As you will see in the examples below it works on more than just the Q’s. Remember, to get paid on Wall Street, you need to know the “What, not the why.”
Single Stock Examples
Apple (AAPL) is one of the best examples. Thus far in the 2000’s, the 200-week moving average has contained AAPL’s move. AAPL visited the 200-week and found support in 2008 (Global Financial Crisis), 2013, 2016, and 2019 and went on to make new highs after each visit.
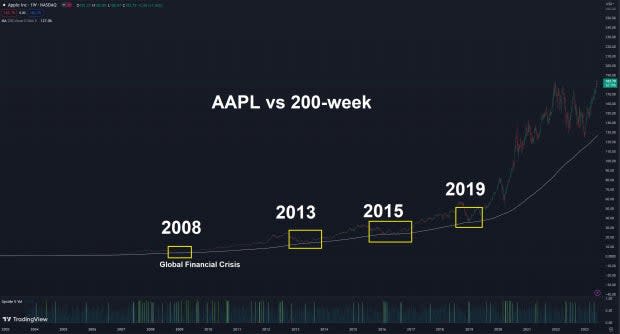
Image Source: Tradingview
Nvidia (NVDA) tagged the line in 2019 (~$33 a share), during the pandemic crash of 2020 (~$46 per share), and in October 2022 (~$125).
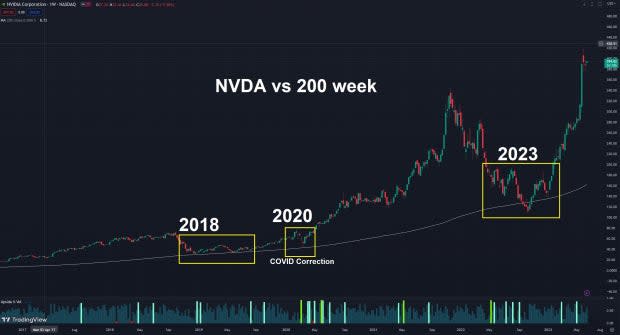
Image Source: Tradingview
Microsoft (MSFT) pulled back to the moving average in October 2022 for the first time in a decade and found support nearly to the penny.
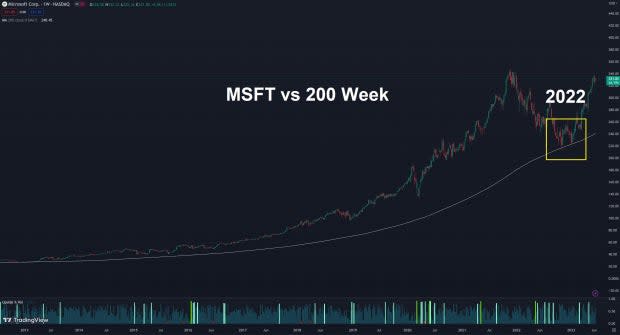
Image Source: Tradingview
What to Look For
Of course, hindsight is 20/20 on Wall Street and there is no such thing as a panacea – this includes the 200-week moving average. However, below are 3 ways to increase your odds of success when using the indicator, including:
Stick to the leaders: There is a significant difference between buying a stock simply because it’s on sale and buying a leading stock at a discount. Buy institutional quality, fundamentally strong stocks that are pulling back because of the macro environment – not the underlying stock’s fundamentals. For example, even as Nvidia corrected 2022, it grew its earnings.
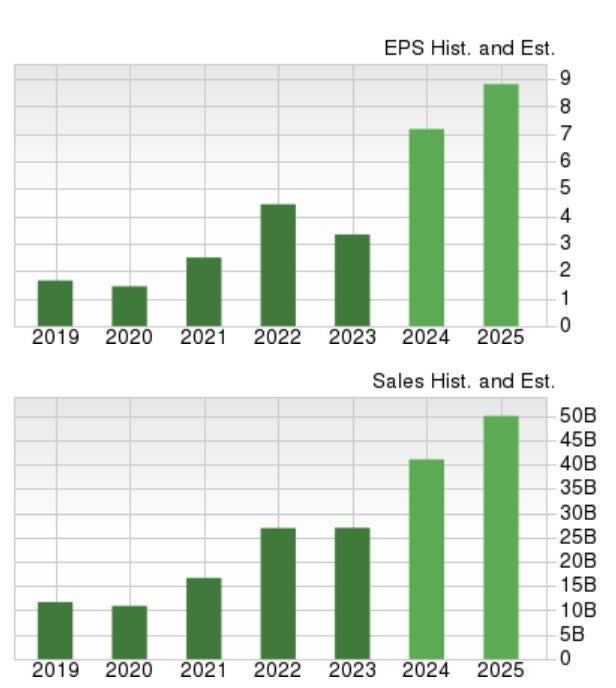
Image Source: Zacks Investment Research
Patience and conviction are required: If it were easy to buy markets when they were falling, everyone would be rich. Long-term trades require patience, confidence, and vision.
Scale into positions: Successful investing is about putting the odds in your favor. However, even if the odds are stacked in your favor, it only ensures some trades will work out. For longer-term trades, you must have an exit plan if you’re wrong. Conversely, a prudent method to enter a long-term trade is to enter in pieces – buy a small piece, and as the trade starts to work in your favor, buy more. Let the market pull you in.
Conclusion
Bear markets are brutal for investors. However, savvy investors can turn crisis into opportunity and use this long-term signal to gain an edge in the market and build conviction.
Want the latest recommendations from Zacks Investment Research? Today, you can download 7 Best Stocks for the Next 30 Days. Click to get this free report
Apple Inc. (AAPL) : Free Stock Analysis Report
Microsoft Corporation (MSFT) : Free Stock Analysis Report
NVIDIA Corporation (NVDA) : Free Stock Analysis Report
Las Vegas Sands Corp. (LVS) : Free Stock Analysis Report
Invesco QQQ (QQQ): ETF Research Reports
Alphabet Inc. (GOOGL) : Free Stock Analysis Report
DoorDash, Inc. (DASH) : Free Stock Analysis Report
