
Five Below (FIVE) Q1 Earnings Miss Estimates, Sales Rise Y/Y
Five Below, Inc. FIVE reported first-quarter fiscal 2024 results, wherein the top and bottom lines missed the Zacks Consensus Estimate. However, net sales increased and earnings decreased on a year-over-year basis.
The company remains focused on driving sales through pricing tests, marketing initiatives and cost optimization efforts while maintaining its commitment to strategic pillars such as store expansion and product strategy.
Five Below, Inc. Price, Consensus and EPS Surprise
Five Below, Inc. price-consensus-eps-surprise-chart | Five Below, Inc. Quote
Let’s Delve Deeper
Five Below posted earnings per share of 60 cents in the first quarter, which lagged the Zacks Consensus Estimate of 62 cents. Also, the company’s earnings per share decreased 10.4% from 67 cents in the year-ago quarter.
Net sales of $811.9 million increased 11.8% year over year but missed the Zacks Consensus Estimate of $832 million. Comparable sales decreased 2.3%, driven by a 2.8% decline in transaction volume, which was partially mitigated by a 0.5% increase in the average transaction value. The rise in average transaction value was due to higher average unit prices, although this was largely counterbalanced by a reduction in the number of units per transaction.
The gross profit grew 12.2% year over year to $263.5 million. Also, the gross margin increased approximately 20 basis points (bps) year over year to 32.5%, primarily driven by lower-than-expected inbound freight costs. The metric surpassed our estimate of 32.3%.
We note that selling, general and administrative (SG&A) expenses rose 16.5% to $190.2 million. SG&A, as a percentage of net sales, increased approximately 100 bps to 23.4%. This increase was mainly due to fixed cost deleverage, a one-time legal expense, higher pre-opening expenses due to more store openings compared with last year, and a planned marketing shift into the first quarter. The one-time legal expense contributed roughly 20 bps to SG&A as a percentage of sales. Our estimate for SG&A expenses, as a rate of net sales, was pegged at 27.3%.
Adjusted operating income was $38.2 million compared to $42.4 million in the first quarter of fiscal 2023. The adjusted operating margin decreased approximately 110 bps and fell to 4.7%.
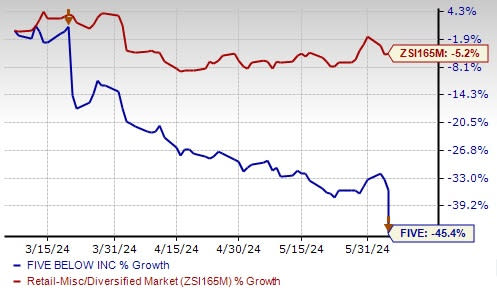
Image Source: Zacks Investment Research
Financials
Five Below ended the fiscal first quarter with cash and cash equivalents of $96.3 million, and short-term investment securities of $273.3 million. Total shareholders’ equity was $1.58 billion as of May 4. The company repurchased approximately 182,000 shares in the first quarter at a cost of about $30.0 million.
Store Update
The company opened 61 new stores and ended the quarter with a total of 1,605 stores across 43 states. This represents a 17.4% increase in the number of stores compared with the end of the first quarter of fiscal 2023. It plans to open approximately 60 new stores in the second quarter compared with 40 stores opened in the year-ago quarter.
The company plans to open approximately 230 stores by the end of fiscal 2024, thereby taking the total count to 1,774 stores, which represents a unit growth of approximately 15%.
Guidance
For the second quarter, Five Below expects net sales to be between $830 million and $850 million, representing an increase in the range of 9.4-12% compared with the same period last year. The company anticipates a mid-single-digit decrease in comparable sales. The operating margin is projected to be 5.2% at the midpoint, with a deleverage of approximately 250 bps. Net income is expected to be between $32 million and $38 million, with earnings per share ranging from 57 cents to 69 cents.
For full fiscal 2024, Five Below forecasts net sales to be in the range of $3.79-$3.87 billion, reflecting a 7.9- 10.2% increase from fiscal 2023. Comparable sales are expected to decrease in the band of 3-5%. Adjusted operating margin is anticipated to be 9.8% at the midpoint, with a deleverage of 90 bps. Net income is estimated to be between $277 million and $299 million, with adjusted earnings per share between $5 and $5.40. Gross capital expenditures are expected to be in the range of $345-$355 million.
Shares of this Zacks Rank #4 (Sell) company have plunged 45.4% in the past three months compared with the industry’s 5.2% decline.
Key Picks
A few better-ranked stocks are The Gap, Inc. GPS, Abercrombie & Fitch Co. ANF and Canada Goose GOOS.
Gap is a premier international specialty retailer offering a diverse range of clothing, accessories and personal care products. The company currently sports a Zacks Rank #1 (Strong Buy). You can see the complete list of today’s Zacks #1 Rank stocks here.
The Zacks Consensus Estimate for Gap’s fiscal 2024 earnings and sales indicates growth of 17.5% and 0.1%, respectively, from fiscal 2023’s reported figures. GPS has a trailing four-quarter average earnings surprise of 202.7%.
Abercrombie is a specialty retailer of premium, high-quality casual apparel. The company sports a Zacks Rank of 1, at present. ANF delivered a 28.9% earnings surprise in the last reported quarter.
The consensus estimate for Abercrombie’s current fiscal-year earnings and sales indicates growth of 47.5% and 10.5%, respectively, from fiscal 2023 reported figures. ANF has a trailing four-quarter average earnings surprise of 210.3%.
Canada Goose is a global outerwear brand. It sports a Zacks Rank of 1, at present.
The Zacks Consensus Estimate for Canada Goose’s current fiscal-year earnings indicates growth of 13.7% from the year-ago period’s reported figures. GOOS has a trailing four-quarter average earnings surprise of 70.9%.
Want the latest recommendations from Zacks Investment Research? Today, you can download 7 Best Stocks for the Next 30 Days. Click to get this free report
Abercrombie & Fitch Company (ANF) : Free Stock Analysis Report
The Gap, Inc. (GPS) : Free Stock Analysis Report
Five Below, Inc. (FIVE) : Free Stock Analysis Report
Canada Goose Holdings Inc. (GOOS) : Free Stock Analysis Report
