
Darden (DRI) Q4 Earnings Surpass Estimates, Revenues Lag
Darden Restaurants, Inc. DRI reported mixed fourth-quarter fiscal 2024 results, with earnings beating the Zacks Consensus Estimate and revenues missing the same. The metrics increased on a year-over-year basis. Following results, the stock inched up 1.3% in the pre-market trading session.
Earnings & Revenues
During the fiscal third quarter, Darden reported adjusted earnings per share (EPS) of $2.65, beating the Zacks Consensus Estimate of $2.62. In the prior-year quarter, DRI reported an adjusted EPS of $2.58.
Total sales during the quarter came in at $2.95 billion, missing the consensus mark of $2.98 billion. Sales increased 6.8% from the prior-year quarter’s level. The upside was backed by the addition of 80 company-owned Ruth's Chris restaurants along with 37 other net new restaurants.
Darden Restaurants, Inc. Price, Consensus and EPS Surprise
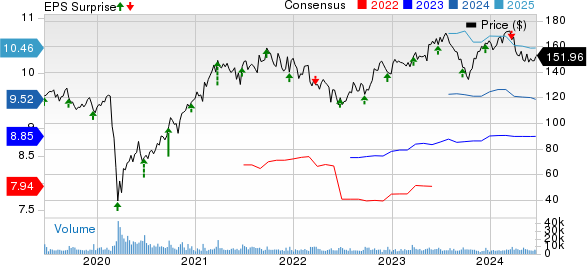
Darden Restaurants, Inc. price-consensus-eps-surprise-chart | Darden Restaurants, Inc. Quote
Sales by Segments
Darden reports business under four segments — Olive Garden, LongHorn Steakhouse, Fine Dining, including The Capital Grille and Eddie V's and Other Business.
During the fiscal fourth quarter, sales at Olive Garden moved up 0.7% year over year to $1.28 billion. Our estimate for the metric was $1.26 billion. Comps in the segment fell 1.5% year over year compared with a 1.8% fall reported in the previous quarter.
At LongHorn Steakhouse, sales were up 7.2% year over year to $762.7 million. Our estimate for the metric was $713.2 million. Comps in the segment rose 4% year over year compared with 2.3% growth reported in the previous quarter.
Sales in Fine Dining increased 55.9% year over year to $327.1 million. Our estimate for the metric was $376.6 million. Comps in the segment dropped 2.6% year over year compared with a 2.3% fall reported in the previous quarter.
Sales in Other Business rose 2% year over year to $590 million. Our estimate for the metric was $611.4 million. Comps in the Other Business dropped 1.1% year over year compared with a 2.6% fall reported in the previous quarter.
Operating Highlights
In the fiscal fourth quarter, total operating costs and expenses increased 7% year over year to $2.56 billion. The upside was primarily due to increased food and beverage costs, restaurant expenses and labor costs. The figure compares to our projection of $2.57 billion.
Balance Sheet
As of May 26, 2024, cash and cash equivalents came in at $194.8 million compared with $367.8 million as of May 28, 2023.
During the fiscal fourth quarter, inventories came in at $290.5 million compared with $298.2 million reported in the previous quarter. As of May 26, 2024, long-term debt was $1.37 billion compared with $884.9 million in the prior year period.
During the fiscal fourth quarter, Darden’s board of directors repurchased approximately 0.6 million shares of its common stock, worth approximately $97.3 million. As of the fiscal fourth quarter, the company stated availability of approximately $915 million under the $1-billion repurchase authorization.
The company declared a 6.9% dividend hike to $1.40 per share, payable on Aug 1, 2024, to shareholders of record as of Jul 10, 2024.
Fiscal 2024 Highlights
Total revenues in the fiscal 2024 amounted to nearly $11.39 billion compared with $10.48 billion in the fiscal 2023.
Operating income in the fiscal 2024 totaled $1.3 billion compared with $1.2 billion reported in the fiscal 2023.
In the fiscal 2024, adjusted EPS came in at $8.88 per share compared with $8 reported in the previous year.
Fiscal 2025 Outlook
For the fiscal 2025, the company expects total sales to be in the range of $11.8-$11.9 billion. Same-restaurant sales growth in the fiscal 2025 is anticipated to be in the range of 1-2% year over year. Diluted EPS from continuing operations are anticipated in the band of $9.40-$9.60.
The company expects to open 45-50 net new restaurants and projects a total capital spending of $550-$600 million in the fiscal 2025.
Zacks Rank & Key Picks
Darden currently carries a Zacks Rank #3 (Hold).
Some better-ranked stocks in the Zacks Retail-Wholesale sector include:
Wingstop Inc. WING sports a Zacks Rank #1 (Strong Buy) at present. It has a trailing four-quarter negative earnings surprise of 21.4%, on average. The stock has surged 123.7% in the past year. You can see the complete list of today’s Zacks #1 Rank stocks here.
The Zacks Consensus Estimate for WING’s 2024 sales and EPS suggests a rise of 27.5% and 37.1%, respectively, from year-ago levels.
Brinker International, Inc. EAT currently carries a Zacks Rank #2 (Buy). It has a trailing four-quarter earnings surprise of 213.4%, on average. EAT’s shares have risen 88.6% in the past year.
The Zacks Consensus Estimate for EAT’s 2024 sales and EPS indicates 5.1% and 41.3% growth, respectively, from the year-earlier actuals.
El Pollo Loco Holdings, Inc. LOCO currently carries a Zacks Rank #2 (Buy). It has a trailing four-quarter earnings surprise of 19.4%, on average. LOCO’s shares have risen 9.8% in the past year.
The Zacks Consensus Estimate for LOCO’s 2025 sales and EPS indicates 3.8% and 9.9% growth, respectively, from the prior-year figures.
Want the latest recommendations from Zacks Investment Research? Today, you can download 7 Best Stocks for the Next 30 Days. Click to get this free report
Darden Restaurants, Inc. (DRI) : Free Stock Analysis Report
Brinker International, Inc. (EAT) : Free Stock Analysis Report
El Pollo Loco Holdings, Inc. (LOCO) : Free Stock Analysis Report
Wingstop Inc. (WING) : Free Stock Analysis Report
