
Bitcoin Drops Below 200-Day Average, Brings Bull Market Trendline Into Focus
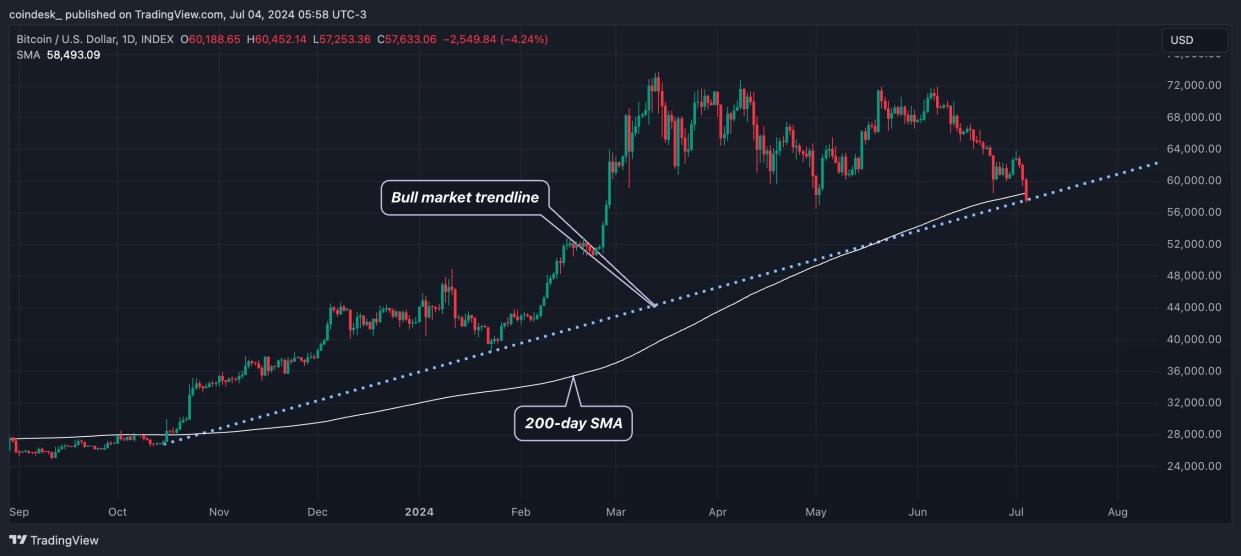
BTC fell below the 200-day SMA line for the first time since October.
The focus now is on the trendline representing the surge from October lows.
Bitcoin's {{BTC}} decline gathered pace as the largest cryptocurrency fell for a third straight day, dropping below the 200-day simple moving average (SMA), a good indicator of long-term price trends in both traditional and crypto markets.
The cryptocurrency slid below the average's $58,492 level during European hours on Thursday to less than $57,300, a price last seen on May 2, according to data on charting platform TradingView.
Markets that consistently trade below the 200-day average are said to be in a downtrend, while those trading above the average are considered bullish. BTC rose past the 200-day SMA in October, when the average value was $28,000. The breakout – fueled by expectations for a spot bitcoin ETF in the U.S. – paved the way for a rally to record highs above $70,000 by March.
One factor in bitcoin's price movements is the U.S. interest rate. As rates fall, the attraction of riskier investments such as cryptocurrencies increases. The minutes of the Federal Reserve meeting released Wednesday showed policymakers led by Chairman Jerome Powell do not want to cut rates until more data emerges to give them greater confidence that inflation is moving sustainably to their 2% target. That may come as early as tomorrow, when the Labor Department releases its non-farm payrolls figure for June.
"We believe hawkish comments from Jerome Powell and the ongoing selling pressure are likely to push BTC down to 52,000," Valentin Fournier, a digital assets analyst at advisory firm brn, said in an email. "However, we recommend viewing this as a buying opportunity, as improving regulations around cryptocurrencies and cooling inflation in the US have not been fully priced in and are likely to bring strong momentum once investors shift focus to a longer-term vision."
See also: Bitcoin Plunges Under $59K as Crypto Bulls See $230M Liquidations
The sell-off may run out of steam if the payrolls data shows the labor market weakened in June. The figure is forecast to show payrolls increased by 195,000, a notable slowdown from 272,000 a month before, according to FXStreet. The jobless rate is forecast to have held steady at 4.0%, while average hourly earnings are projected to have slowed to 3.9% from 4.1% year-on-year.
The bull market progression can be identified by a rising trendline connecting October and January lows. BTC's latest break below the 200-day line has put the focus on the bull market trendline support at $57,590.
A close (midnight UTC) below that level could lead to further selling and downward price momentum, as traders often use trendline breakdowns as indicators to make trading decisions.
Fournier is not alone in seeing further declines. According to Alex Kuptsikevich, a senior market analyst at FxPro, prices could slide to as low as $51,500 in the short term.
"From the current position, a 12% drop to $51.5k (February consolidation area) is more likely than the same amount of growth to $65.8k (50-day MA)," Kuptsikevich said in an email.
UPDATE (July 4, 9:45 UTC): Adds interest rate, jobs report starting in fourth paragraph, analyst quote in fourth, possible decline in last two paragraphs.

