
Best Buy (BBY) Q1 Earnings Beat Estimates, Revenues Dip Y/Y
Best Buy Co., Inc. BBY has reported first-quarter fiscal 2025 results, wherein the bottom line beat the Zacks Consensus Estimate while the top line missed. While revenues decreased year over year, earnings improved from the year-ago period.
Q1 Details
Best Buy’s adjusted earnings of $1.20 per share beat the Zacks Consensus Estimate of $1.07. The bottom line increased 4.3% from earnings of $1.15 per share in the year-ago period.
Best Buy Co., Inc. Price, Consensus and EPS Surprise
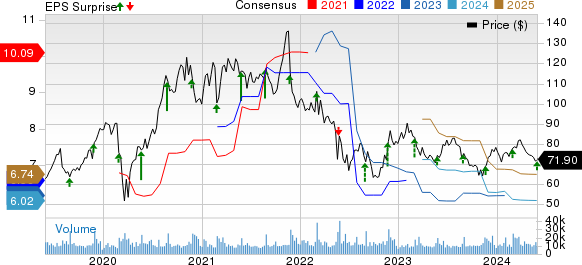
Best Buy Co., Inc. price-consensus-eps-surprise-chart | Best Buy Co., Inc. Quote
Enterprise revenues declined 6.5% from the prior fiscal year’s quarterly number to $8,847 million. The figure missed the consensus estimate of $8,958 million. Enterprise comparable sales dropped 6.1% year over year.
Gross profit dropped 4% year over year to $2.1 billion while the gross margin expanded 60 basis points (bps) to 23.3%. The metric marginally beat our estimate of 20.3%. Adjusted operating income was $735 million, up from $704 million in the year-ago quarter. The adjusted operating margin increased 20 bps to 5%. We anticipated an adjusted operating margin of 4.8%.
We note that adjusted SG&A expenses dipped 6.4% year over year to $1.7 billion whereas the same increased 10 bps to 19.6% as a percentage of revenues. We expected a deleverage of 20 bps in SG&A expenses as a percentage of revenues.
Segmental Details
The Domestic segment’s revenues fell 6.8% to $8.20 billion. This decline from the last fiscal year’s quarterly reading was mainly induced by a comparable sales decrease of 6.3%. From a merchandising perspective, the key drivers of the comparable sales decline were appliances, home theater, gaming and mobile phones, somewhat offset by growth in the services and laptop categories. We expected a 5.4% decline in the Domestic segment revenues.
The Domestic segment’s online revenues of $2.52 billion decreased 6.1% on a comparable basis, and as a percentage of total Domestic revenues, online revenues were 30.8% compared with 30.5% last year.
The segment’s gross margin increased 80 bps to 23.4% due to enhanced financial results from the company's membership programs, which were partly offset by lower product margin rates and profit-sharing revenues from its private label and co-branded credit card arrangement.
In the International segment, revenues dipped 3.3% year over year to $644 million, faring better than our estimate of $638.5 million. However, this decrease was somewhat offset by a 3.3% decline in comparable sales. The segment’s operating income was $9 million or 1.4% of revenues, lower than the $21 million or 3.2% of revenues reported in the year-ago quarter.
This segment’s gross margin declined 90 bps to 22.8% primarily on unfavorable product margin rates.
Other Details
Best Buy ended the quarter with cash and cash equivalents of $1.2 billion, long-term debt of $1.1 billion and a total equity of $3.1 billion.
In the fiscal first quarter, BBY returned about $252 million to its shareholders via dividends of $202 million and share repurchases of $50 million. The company’s board has authorized the payment of a quarterly cash dividend of 94 cents per share, payable Jul 11, to shareholders of record as of Jun 20, 2024.
Guidance
For fiscal 2025, including 52 weeks, management projects revenues in the range of $41.3-$42.6 billion and a comparable sales decline in the band of 3-0%. The company had reported consolidated revenues of $43.5 billion, with a comparable sales decline of 6.8% in fiscal 2024.
Best Buy expects an adjusted operating margin of 3.9-4.1% compared with 4.1% in fiscal 2024. It expects adjusted earnings per share between $5.75 and $6.20 compared with$6.37 in fiscal 2024. Capital expenditure is anticipated to be $750 million.
For the second quarter, Best Buy anticipates a year-over-year comparable sales decline of 3%. The adjusted operating income rate is expected to be 3.5%.
Fiscal 2025 consists of 52 weeks compared with 53 weeks in fiscal 2024. The company calculated that the additional week in fiscal 2024 contributed roughly $735 million to its annual revenues. This extra week added about 15 bps to the adjusted operating margin and approximately 30 cents to adjusted earnings per share.
Over the past three months, this Zacks Rank #4 (Sell) company has lost 6.6% against the industry’s 3.9% growth.
Solid Picks in Retail
We have highlighted three better-ranked stocks, namely Gap GPS, American Eagle AEO and Deckers DECK.
Gap, a leading apparel retailer, currently sports a Zacks Rank #1 (Strong Buy). GPS delivered an earnings surprise of 180.9% in the trailing four quarters. You can see the complete list of today’s Zacks #1 Rank stocks here.
The Zacks Consensus Estimate for Gap’s financial-year sales suggests growth of 1.7% from the year-ago reported figure.
American Eagle, a casual apparel retailer, currently carries a Zacks Rank #2 (Buy). AEO delivered an earnings surprise of 22% in the last reported quarter.
The consensus estimate for American Eagle’s current financial-year sales suggests growth of 3.4% from the year-ago reported figure.
Deckers, a footwear and accessories dealer, currently carries a Zacks Rank of 2. DECK delivered an earnings surprise of 32.1% in the trailing four quarters.
The Zacks Consensus Estimate for Deckers’ current financial-year sales suggests growth of 15.8% from the year-ago reported figure.
Want the latest recommendations from Zacks Investment Research? Today, you can download 7 Best Stocks for the Next 30 Days. Click to get this free report
American Eagle Outfitters, Inc. (AEO) : Free Stock Analysis Report
Best Buy Co., Inc. (BBY) : Free Stock Analysis Report
Deckers Outdoor Corporation (DECK) : Free Stock Analysis Report
The Gap, Inc. (GPS) : Free Stock Analysis Report
